Sep
Making Money
Expanded Flat?
Will the dow make another all-time high? As a new month begins and the DJIA being less than 3% from another record high in less than 3 years.
The DJIA closed at 28,645 yesterday from an incredible low of 18,213 at the end of March 2020. This is not a normal market. Seeing traders taunting their trades while holding positions as if the market is healthy.
Anyways, let’s dissect this pattern in two ways to give you a complete analysis and an alternate look all but despite the timing, the results will be very close to the same.
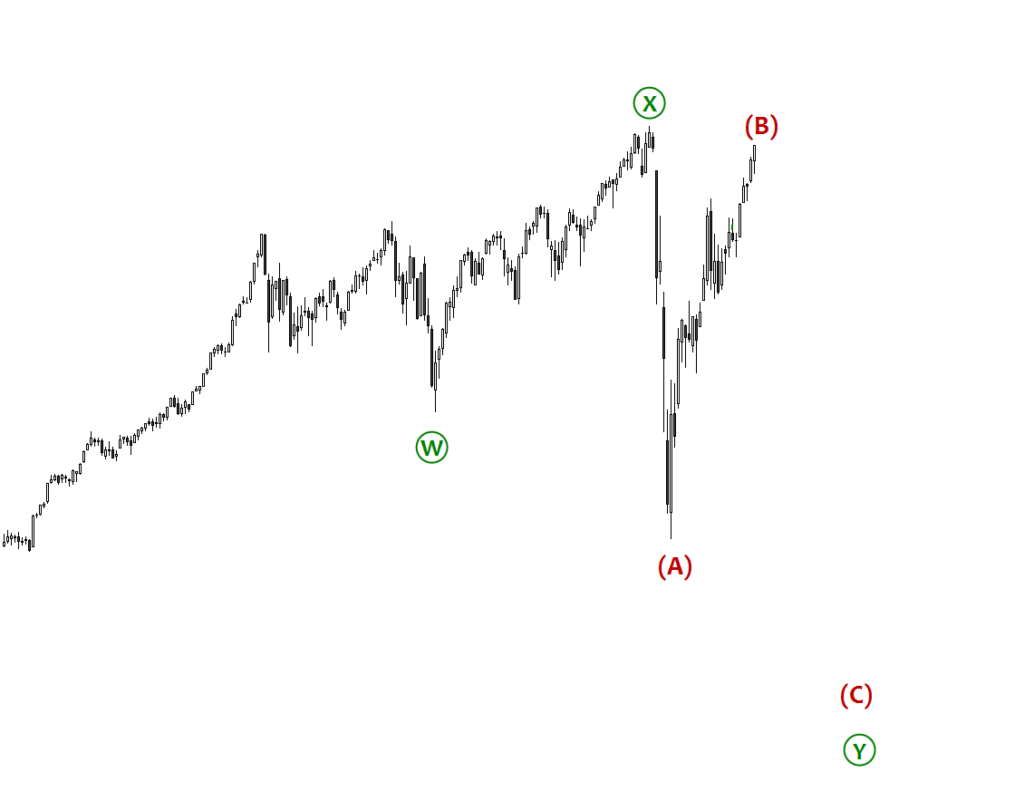
First, we will take a look at a potential double three. Wave W completes with a flat pattern to end toward the end of Dec. 2018. Wave X made new highs with a zigzag for Wave A, triangle for Wave B, and a 5-wave move for Wave C. Subsequently, is when we got that sharp 5 Wave move to potentially begin Wave A of Y. Wave B is so strong, the talking heads call it a V-shape recovery. Wave B has always been called a pump fake. The truth is that Wave B never moves beyond the start of Wave A. This will void the double three patterns. In my opinion, it already has to be that Wave B is more than 90% of Wave A now making this a flat pattern. Double Flat?
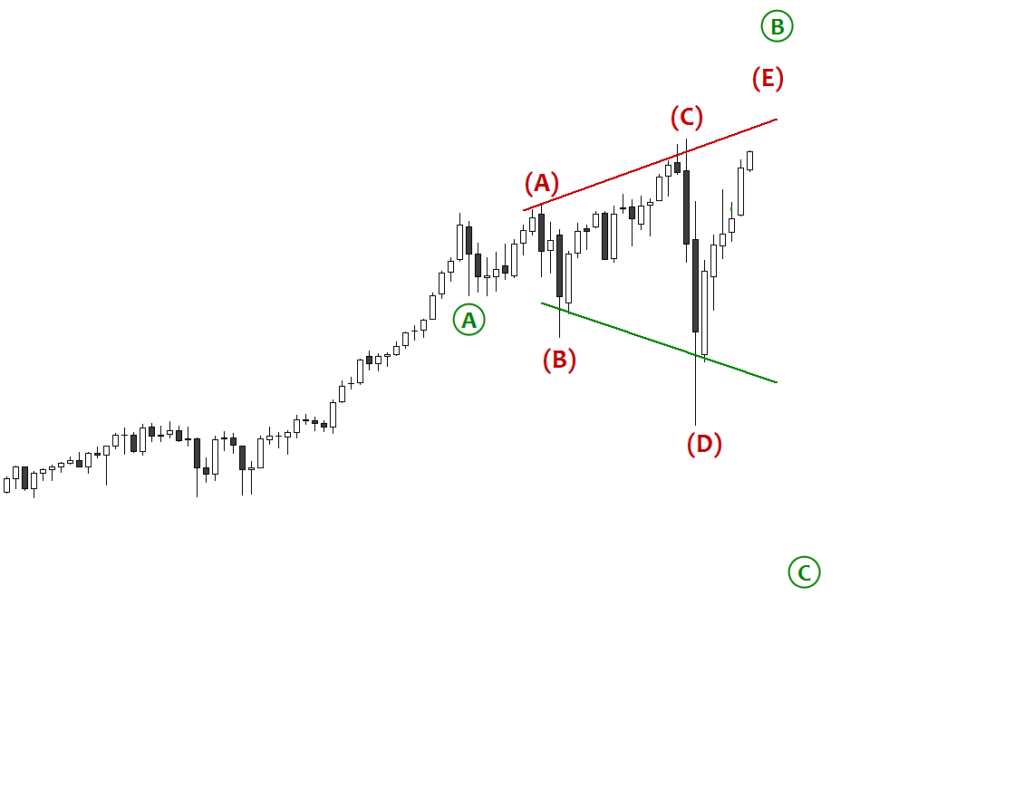
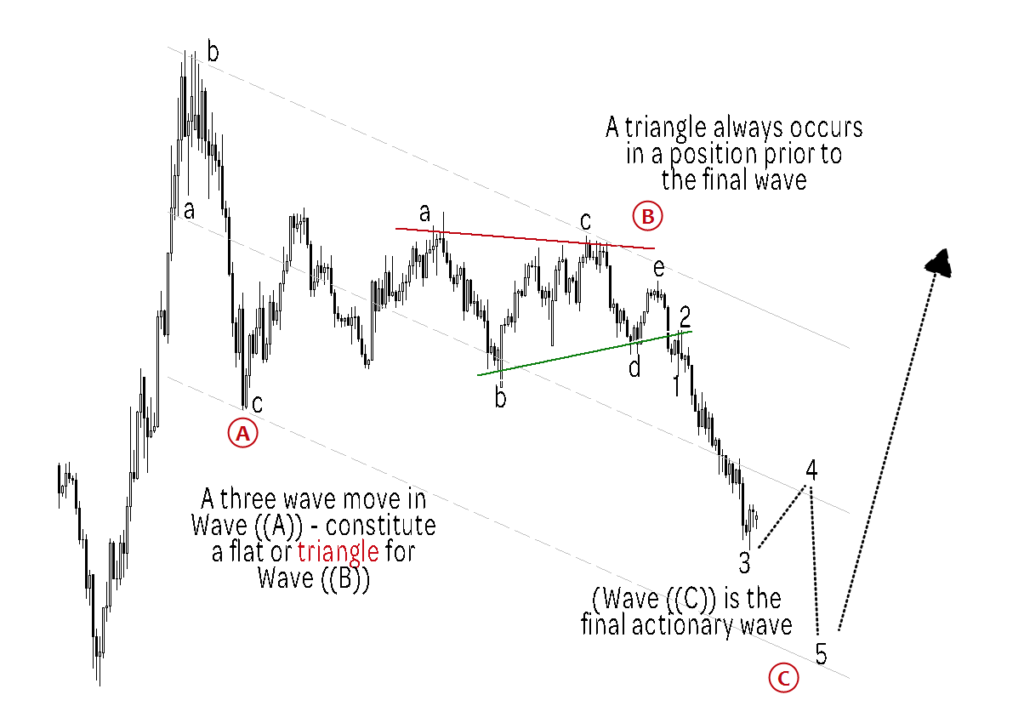
Second, let’s take a look at what I am seeing for an alternate count. In, what I see as an Expanded Flat pattern. Wave A is a three-wave move to the downside. Wave B happens to be a triangle pattern with my forecast sees Wave E completing the triangle pattern for the larger Wave B.
Wave B and D of the triangle are usually the fake-out and in this case, it was to the downside. Do you see the long black down, as opposed to Wave C is not as direct and is more complex as typical Wave C’s are?
If this analysis is correct, Wave E will make a new high as a dramatic kickoff of a new uptrend. This will quickly be reversed. Wave C of the bigger picture will be something to remember, perhaps making a new low below Wave D.