• This topic is empty.
Viewing 1 post (of 1 total)
  • Author
    Posts
  • #12101
    BJay
    Keymaster

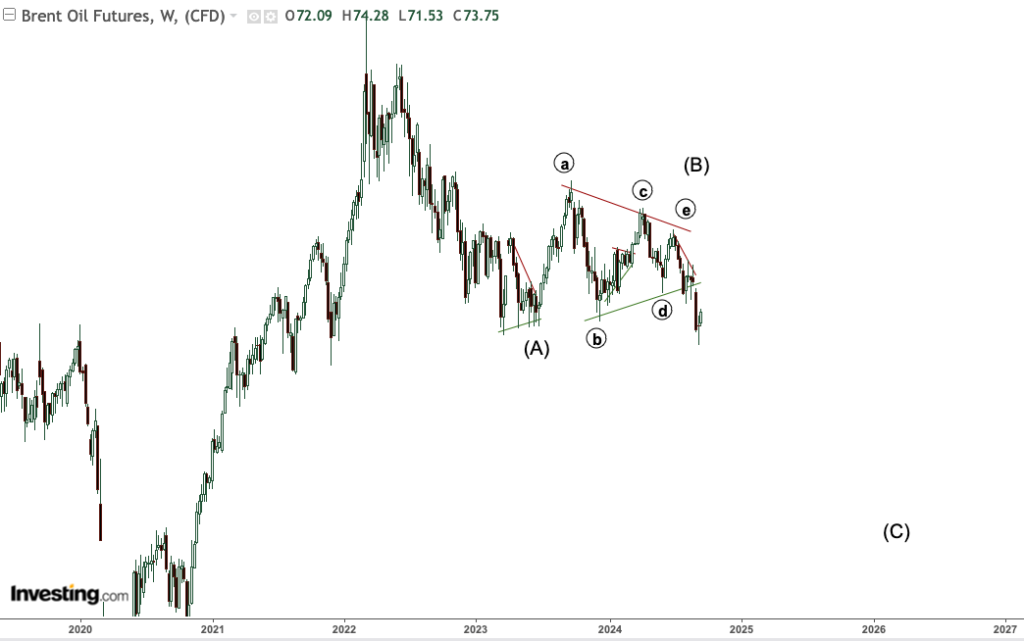
    The decline in oil prices, particularly with Brent Crude breaking out of a 15-month triangle pattern to the downside, can be attributed to several factors within technical analysis. The pattern suggests that oil prices might be entering a bearish phase.

    Here are four key factors for Brent Crude:

    1. Triangle Pattern Breakdown: The recent breakout of Brent Crude from a prolonged triangle pattern indicates a potential shift in market sentiment. Typically, such a breakout signals the end of a consolidation phase and the beginning of a new trend—in this case, a downward trend.
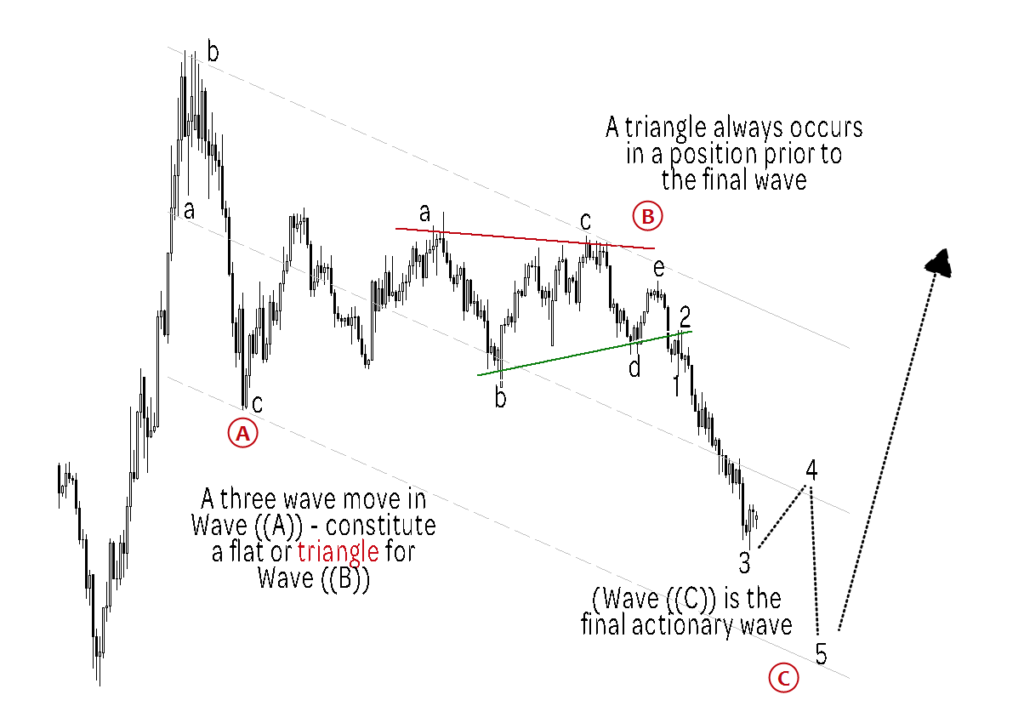
    2. Wave Analysis: If we consider Elliott Wave Theory, the completion of wave ((B)) often suggests that the market could be moving into wave ((C)), which in a Zig-Zag pattern usually implies a more significant decline. The fact that wave ((A)) appears to be complete and wave ((B)) might be done points toward the potential for wave ((C)) to commence, typically driving prices lower.
    3. Pattern Implications: A triangle pattern usually precedes the final actionary wave in a larger degree pattern. If wave ((B)) is indeed complete, we might expect wave ((C)) to be a downward move, reinforcing the bearish outlook for Brent Crude.
    4. Flat Pattern Possibility: If wave ((B)) forms a Flat pattern rather than completing as expected, this could lead to a temporary rise in oil prices. However, the extended time it took for wave ((B)) to develop often supports the view that wave ((C)) is starting and likely to lead to further declines.

    Overall, given the current pattern and the completion of wave ((B)), the technical analysis suggests that Brent Crude prices may continue to fall, aligning with the expectations for wave ((C)) to drive the market lower.


    Brent Crude Triangle Pattern

Viewing 1 post (of 1 total)
  • You must be logged in to reply to this topic.