
Jan
Options
Types of Elliott Wave Triangles
Understanding Elliott Wave Triangles: A Guide for Traders
What Are Elliott Wave Triangles?
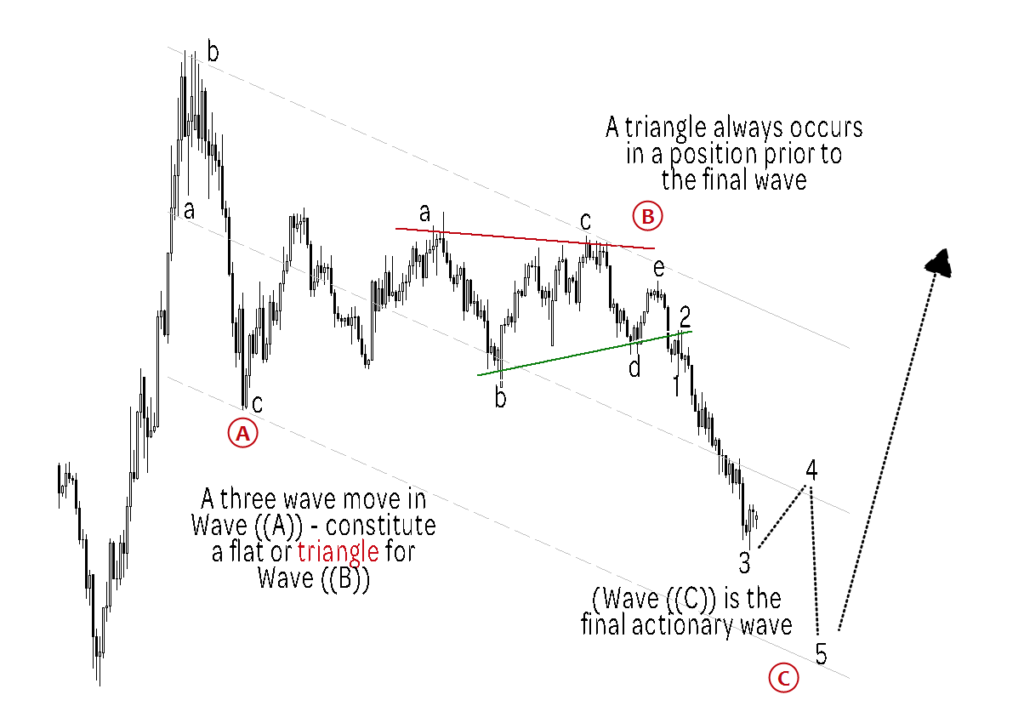
Elliott Wave triangles are corrective wave patterns that typically appear in wave four of an impulsive wave sequence or as part of wave B in an A-B-C corrective structure. These formations indicate a temporary pause in the market before the trend resumes in its primary direction. Triangles reflect market indecision, where buyers and sellers battle for control, leading to contracting price action before a decisive breakout.
Types of Elliott Wave Triangles
There are five main types of Elliott Wave triangles:
- Contracting Triangle – The most common type, characterized by a series of lower highs and higher lows, forming a converging pattern. It consists of five sub-waves labeled A-B-C-D-E.
- Expanding Triangle – This pattern has diverging trendlines, with each wave extending beyond the previous one, showing increased market volatility.
- Ascending Triangle – A bullish formation where the upper trendline remains relatively flat while the lower trendline slopes upwards, suggesting stronger buying pressure.
- Descending Triangle – A bearish pattern where the lower trendline remains flat while the upper trendline slopes downward, indicating selling pressure.
- Running Triangle – A rare formation where wave B extends beyond wave A, signaling strong market momentum in the direction of the primary trend.
How to Identify a Triangle in Elliott Wave Analysis
To successfully identify a triangle pattern, traders should look for the following characteristics:
-
Five Sub-Waves (A-B-C-D-E): Triangles always contain five waves moving within converging or diverging trendlines.
-
Corrective Nature: Triangles occur in corrective phases, either as wave four in an impulse or wave B in a correction.
-
Volume Contraction: As price action narrows, trading volume tends to decrease, confirming the formation of a triangle.
-
Breakout Confirmation: After wave E is completed, the price typically breaks out in the direction of the preceding trend with an increase in volume.
Trading Strategies for Elliott Wave Triangles
Trade the Breakout
Once wave E completes, wait for a decisive breakout beyond the triangle’s trendline before entering a trade.
Use Stop Losses
Place stop losses just beyond the opposite trendline to minimize risk.
Measure Price Target
The breakout move often equals the widest part of the triangle, giving a potential target for profit-taking.
Confirm with Indicators
Use RSI, MACD, and volume analysis to validate the breakout direction.
Conclusion
Elliott Wave triangles are powerful consolidation patterns that signal trend continuation. Recognizing and correctly analyzing these formations can enhance trading precision and risk management. Whether you’re a beginner or an experienced trader, mastering Elliott Wave triangles can provide valuable insights into market behavior and profitable opportunities.