Dissecting The All Too Famous Zig-Zag Pattern
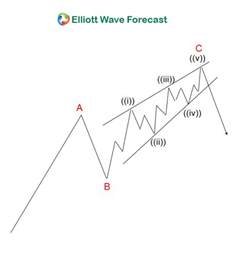
A zigzag in a bull market is a simple three-wave declining pattern labeled A-B-C. The wave sequence is 5-3-5.
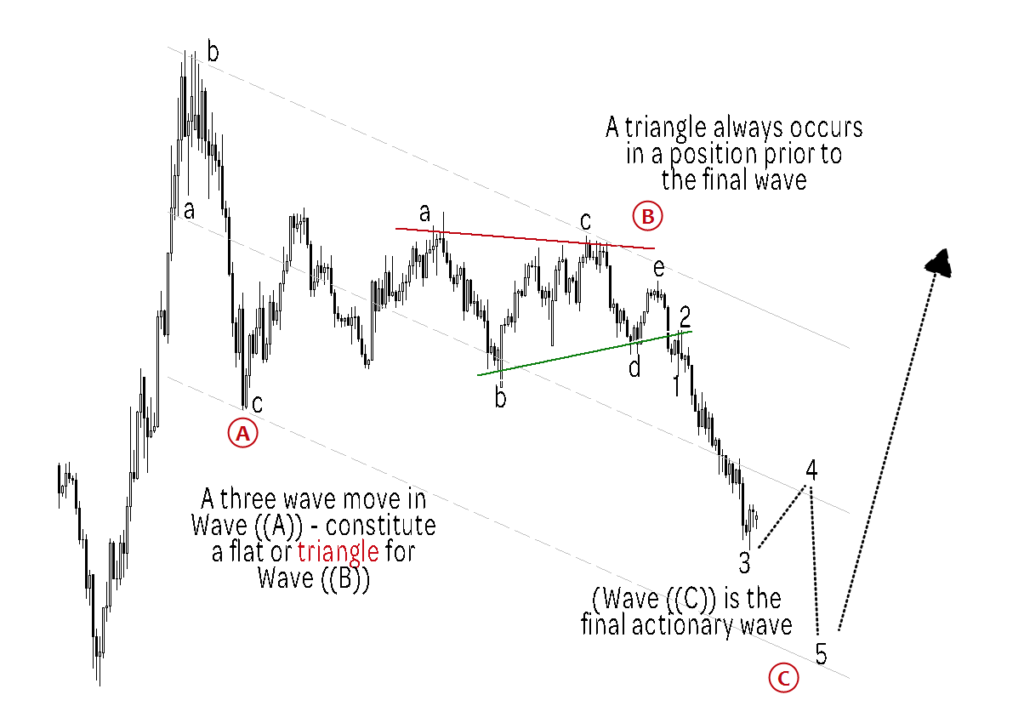
- A three wave move in Wave A, signals a flat or triangle for Wave B
- A triangle always occurs in a position prior to the final wave
- Wave C is the final wave in the sequence