BrashMeans – Stock Analysis and Training Videos Forums Motive Waves Diagonals Ending Diagonal ZM – Zoom Video Communications Inc.

  • This topic is empty.
Viewing 1 post (of 1 total)
  • Author
    Posts
  • #12095
    BJay
    Keymaster

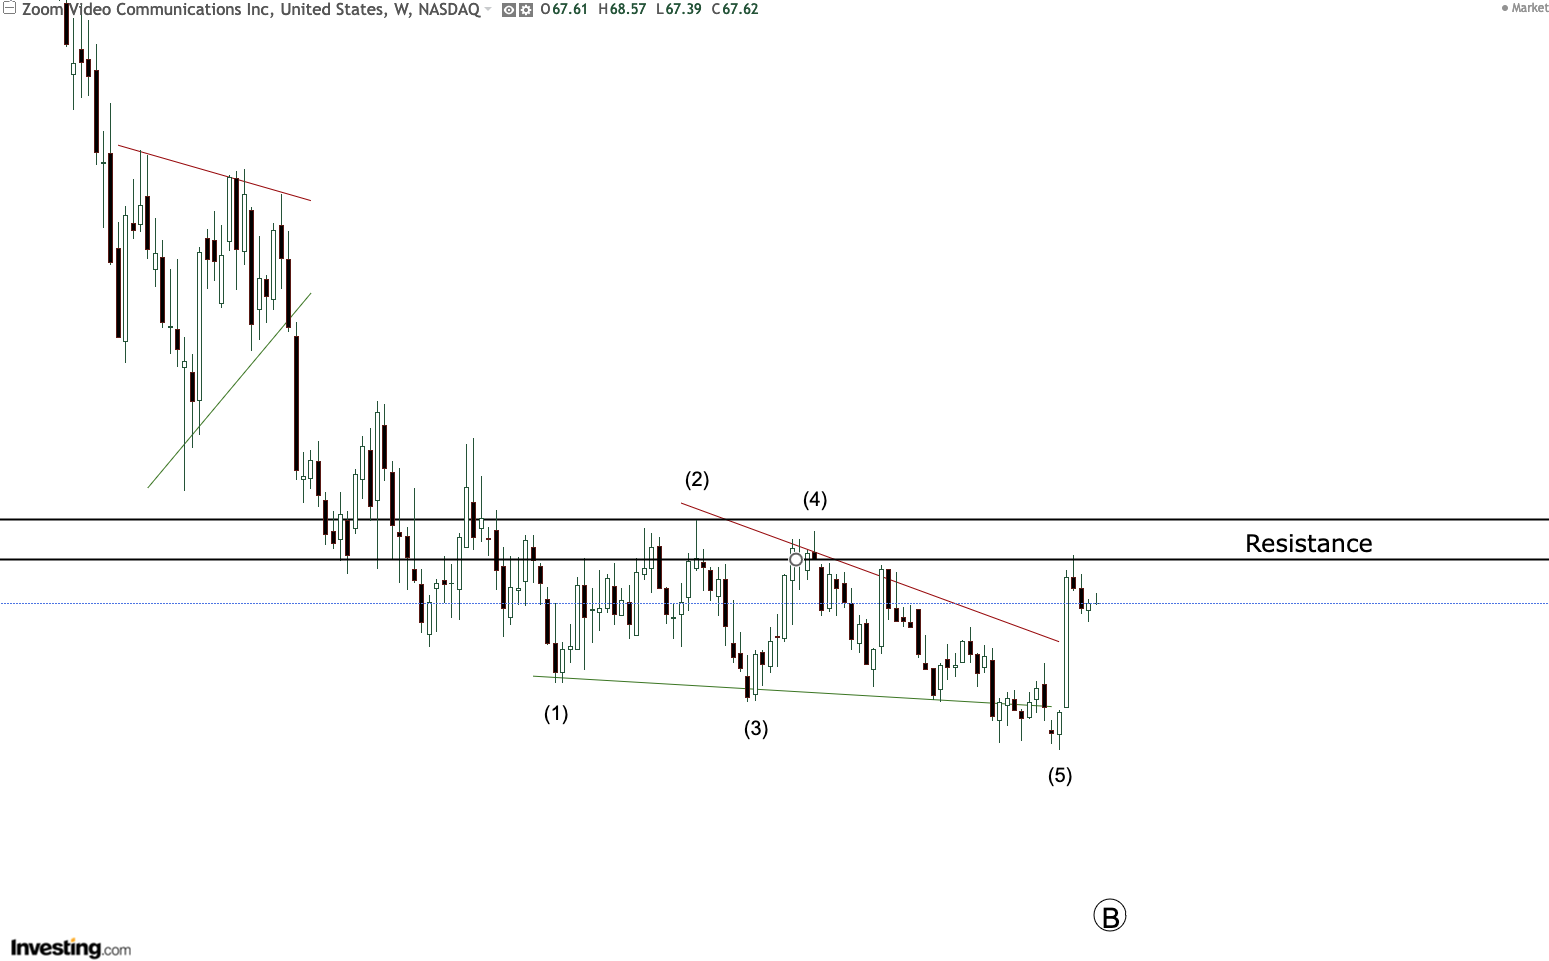
    ZM – Zoom Video Communications Inc.  has developed an ending diagonal pattern after hitting a low of $58.26, which followed a nearly four-year decline from a high of $588.84 in October 2020. This pattern suggests a potential reversal, but the critical question now is whether it will hold after encountering resistance.

    The ending diagonal pattern, which began forming in April 2023, consists of a five-wave structure typical of Elliott Wave Theory’s reversal patterns. Additionally, ZM has demonstrated strong revenue growth, with an annualized rate of 71.39% based on an 8-year Compound Annual Growth Rate.

    Cathie Wood Mops Up $8.1M Worth Of Zoom Stock

    Zoom Video Communications Inc. - Ending Diagonal

    1. Ending Diagonal Pattern:

    • Reversal Pattern: Typically, an ending diagonal signals that a major trend is nearing its conclusion and that a reversal is likely to follow. Since ZM has formed an ending diagonal after a prolonged decline, it suggests that a reversal or at least a significant change in direction could be imminent.

    2. Resistance Level:

    • Impact on Pattern: If the ending diagonal pattern is to hold, ZM needs to overcome or at least test the resistance level effectively. A strong breakout above resistance could validate the pattern and suggest a potential upward trend. Conversely, failure to break through resistance could signal a continuation of the previous downtrend or consolidation.

    3. Historical Decline and Reversal:

    • Previous High and Low: ZM reached a high of $588.84 in October 2020 and a low of $58.26. The significant decline indicates that the stock has been under severe selling pressure. The formation of the ending diagonal after such a decline is a classic setup for a potential reversal.
    • Reversal Validation: For the reversal pattern to be confirmed, we need to see a clear breakout above the resistance level. Additionally, confirmation often comes with increased volume and bullish momentum.

    4. Revenue Growth:

    • Annualized Growth: ZM’s revenue growth rate of 71.39% annualized over the past 8 years indicates strong historical performance. Such robust growth can be a positive indicator for the company’s future prospects, assuming the revenue growth is sustainable and not driven by temporary factors.
    • Impact on Price: Strong revenue growth can support a bullish scenario for the stock price, but it should be considered alongside technical patterns and broader market conditions.

    Summary:

    • Pattern: The ending diagonal suggests a potential reversal, but its success depends on how the stock behaves around resistance.
    • Resistance: A key factor is whether ZM can break through and stay above the resistance level. Monitor this closely.
    • Growth: The impressive revenue growth supports a positive outlook but should be combined with technical analysis for a comprehensive view.

    For a more detailed assessment, you might want to look at additional technical indicators (e.g., moving averages, volume analysis) and monitor broader market conditions. This approach will help in making a more informed judgment about whether the ending diagonal pattern will indeed lead to a significant reversal in ZM’s price trend.

Viewing 1 post (of 1 total)
  • You must be logged in to reply to this topic.