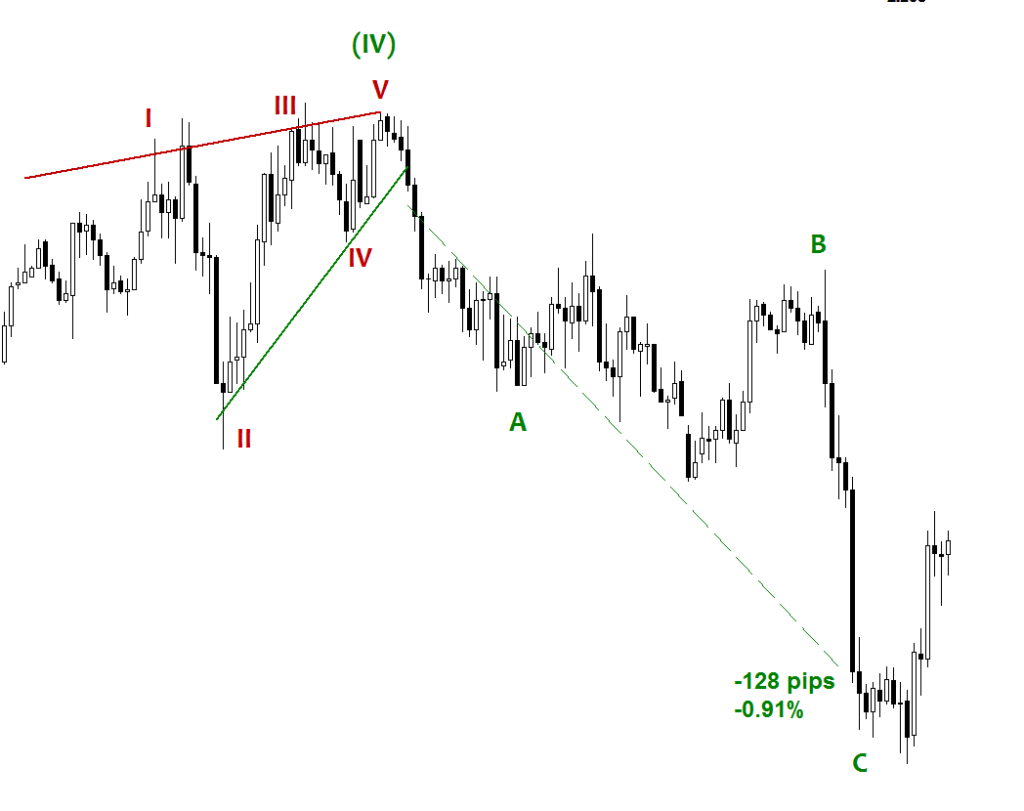
As we make a new low on 04/23/20. The #USDCAD began to hit support with a huge push back to the upside on the 360-minute chart. The candle closed more than ¼ of the previous (long drop) candle. By the very next day, we had already reached a high looking at a potential doji. Now I’m thinking a potential reversal is imminent, the very next candle begins to head south almost immediately. Not even making a new high (Wave 5). A combination of the two of what is now considered a bearish engulfing pattern to end the #EndingDiagonal pattern. (red = resistance and green = support)

The funny thing I saw this forming before I went to bed on Sunday night on the 26th. It was tempting to enter the trade but I held my own for the sake of following my trading plan. This kept me out of this trade, thankfully.
Waking up very early Monday morning the pattern had formed and resistance had broken the bottom channel line. I found my setup and entered the trade.
Now, it’s a waiting game. We made some progress but around 8:30 am I opened up on the lower timeframe 30 min chart to see if I could spot any clues as to what was going on and why this was not moving as planned.
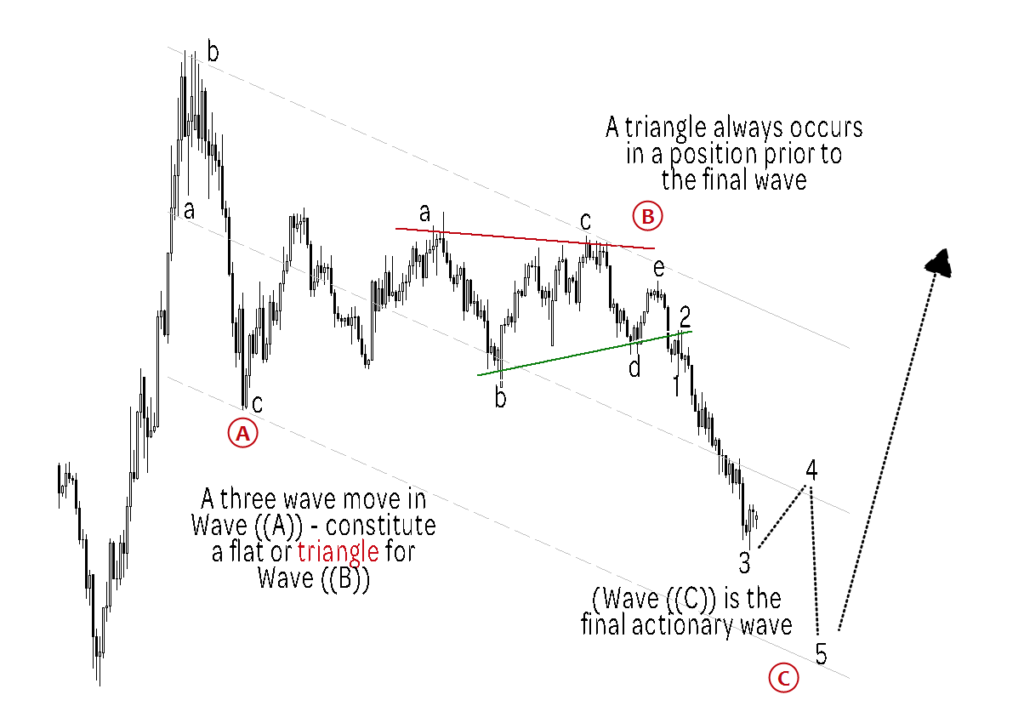
Low and behold appeared to be a running triangle forming, then I realized that it was a running flat pattern. This running flat cause this to retrace almost all of the previous candle on the 360 min chart. And, if I had not realized this pattern I would have exited the trade. #TrustYaProcess
Some experience tells that this is part of a larger pattern and will be headed to the downside of at least 100 pips before reversal. (even though we form a potential head and shoulders pattern). I’m learning to be patient and not jump the gun on this and wait it out.