The charts show that we are at an important juncture in all major markets; #Gold, #DJIA, #DXY, #EURUSD just to name a few. The market may be ready to take a turn for better or worst, depending on your stance in the market bullish or bearish.
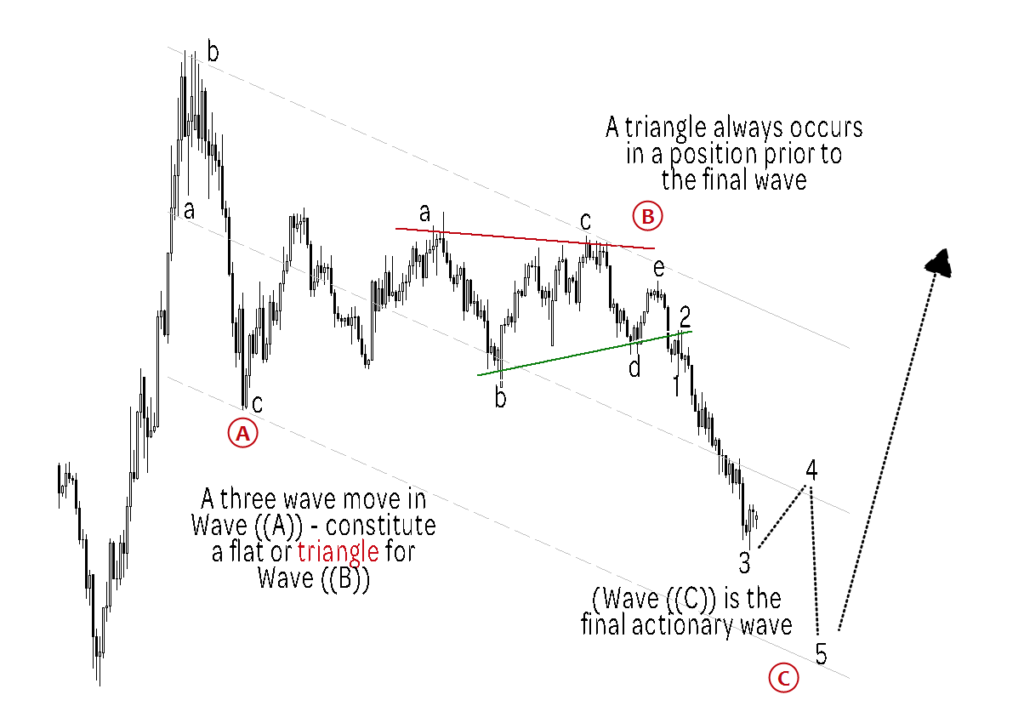
When the three-wave move is complete; does it mean a reversal likely? Yes. A three-wave pattern in wave A constitutes that Wave B will be a Flat Pattern or A Triangle.
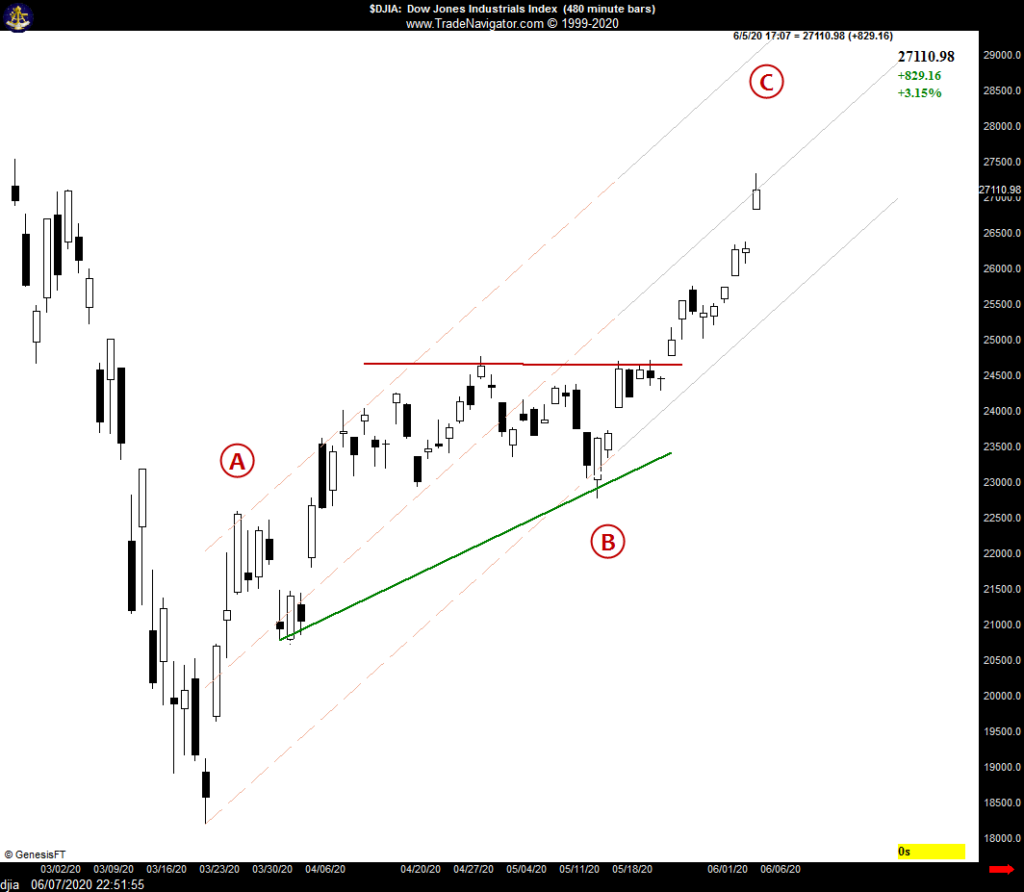
If you look at the #DJIA, you will a similar situation in the opposite direction. The pattern seems to stay within the constraints of the channel lines. 99% of the time, this is a clear indication of a true reversal.
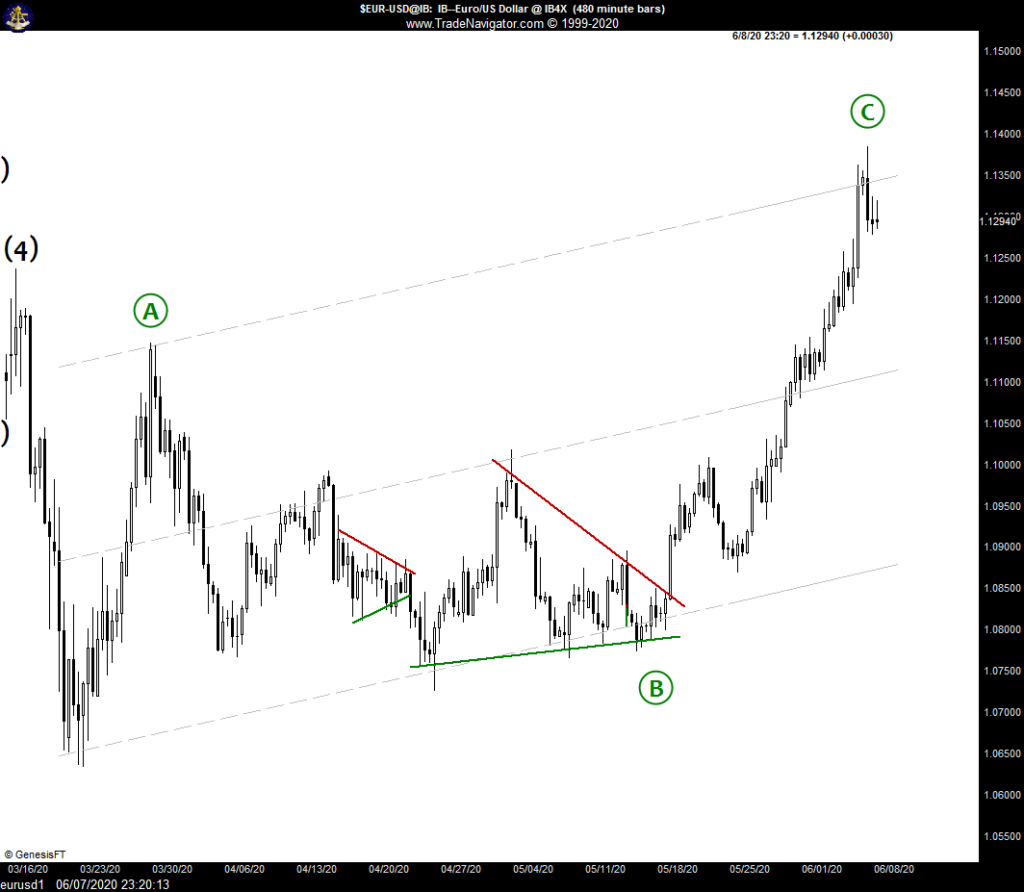
Now, looking at the #EURUSD, the three-wave pattern is at a high between channel line. This doesn’t mean that another high is not imminent, but who knows. All in all, the overall pattern is almost completed.

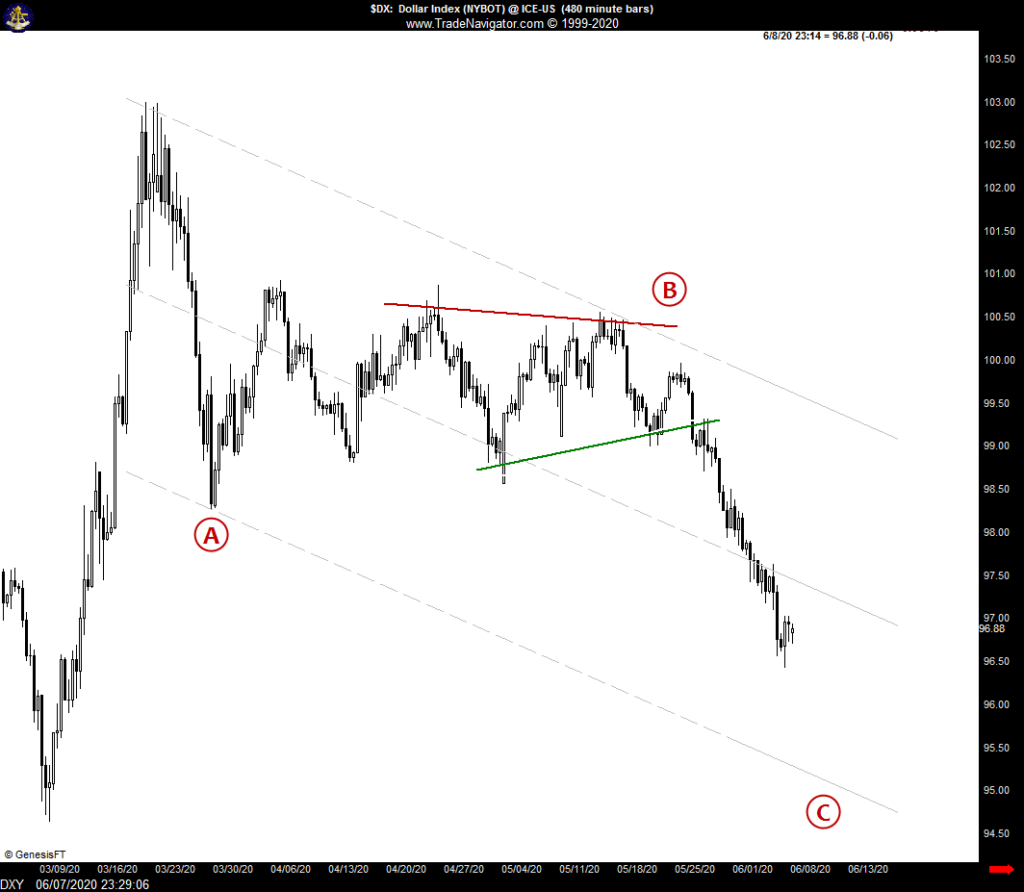
Bet your last dollar. So many have been counting the greenback out for so long, anxiously waiting and wanting it to fail. The this is though, critics may be at the least 3 years too early. #DXY, may even rise to 2002 highs after this potential correction is over. The jury is out.
Be sure to print out or download the PDF from the link below.